
Gennaio 2016
04/Gennaio
Esempio di voltatilità nelle Penny Stocks! (LEI)
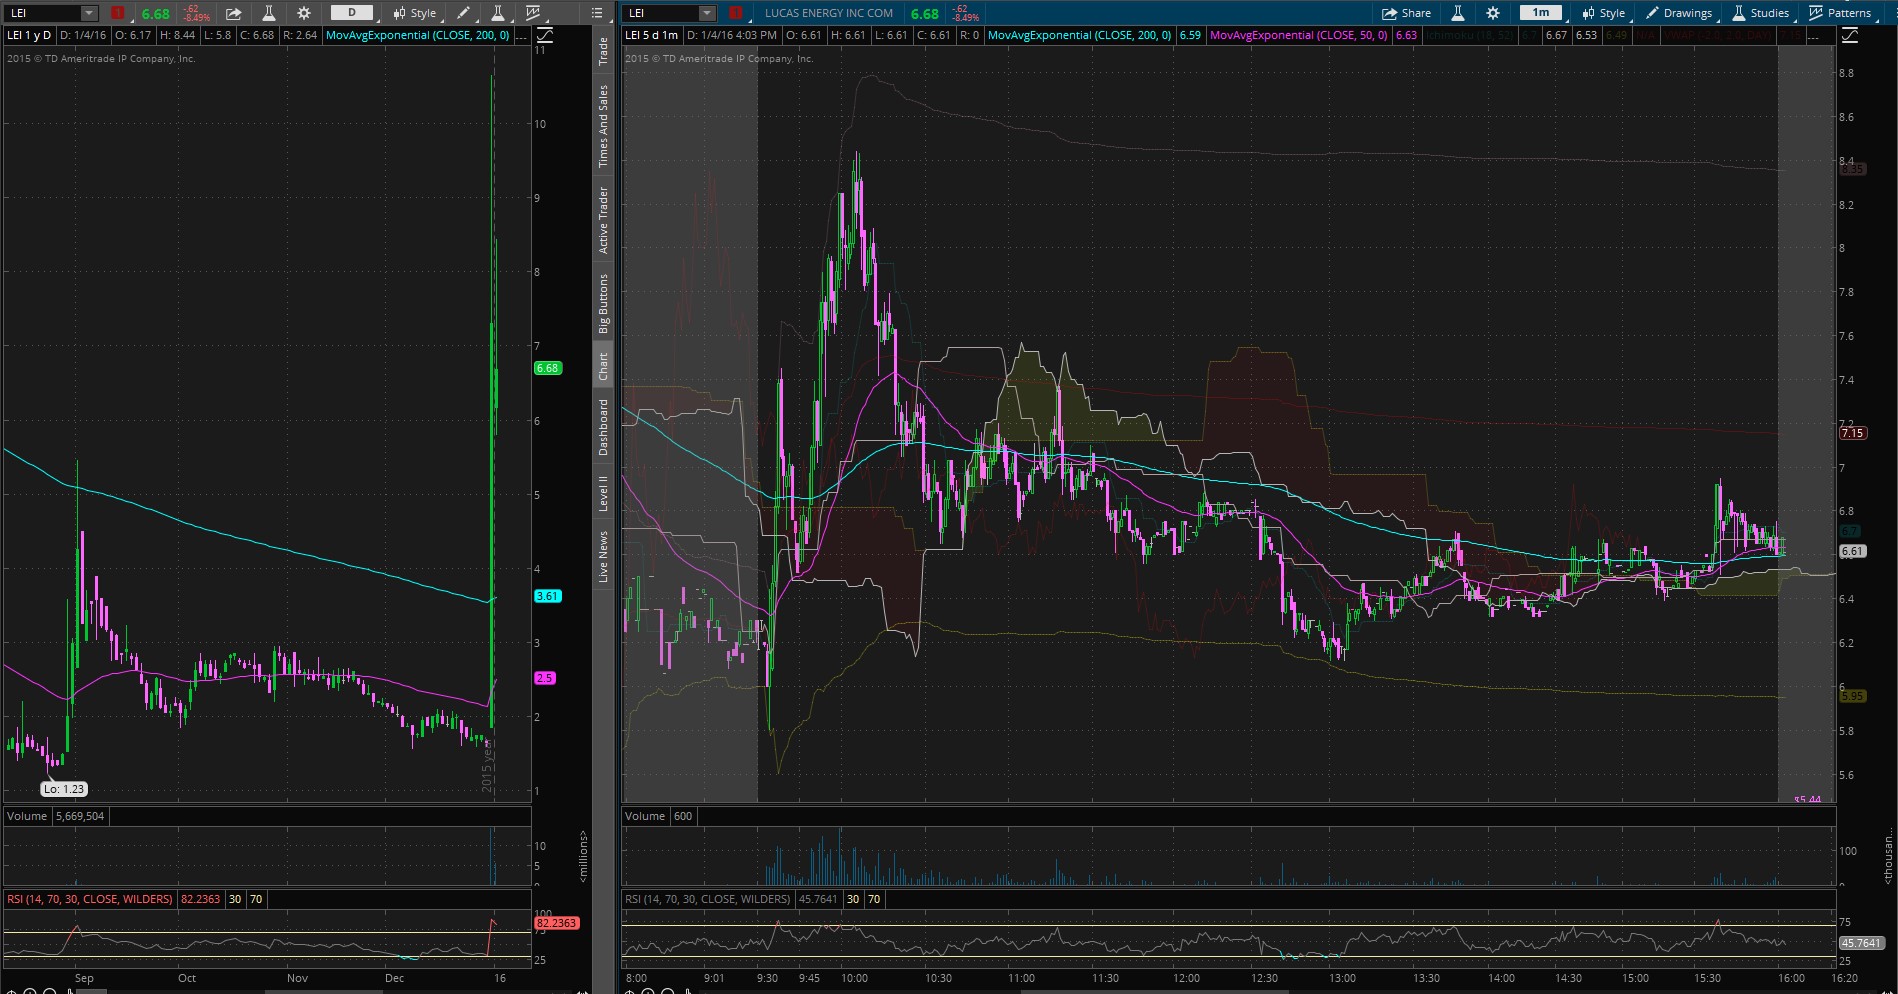
Fino a Dicembre 2015 il Blog è interamente in inglese!
02/December
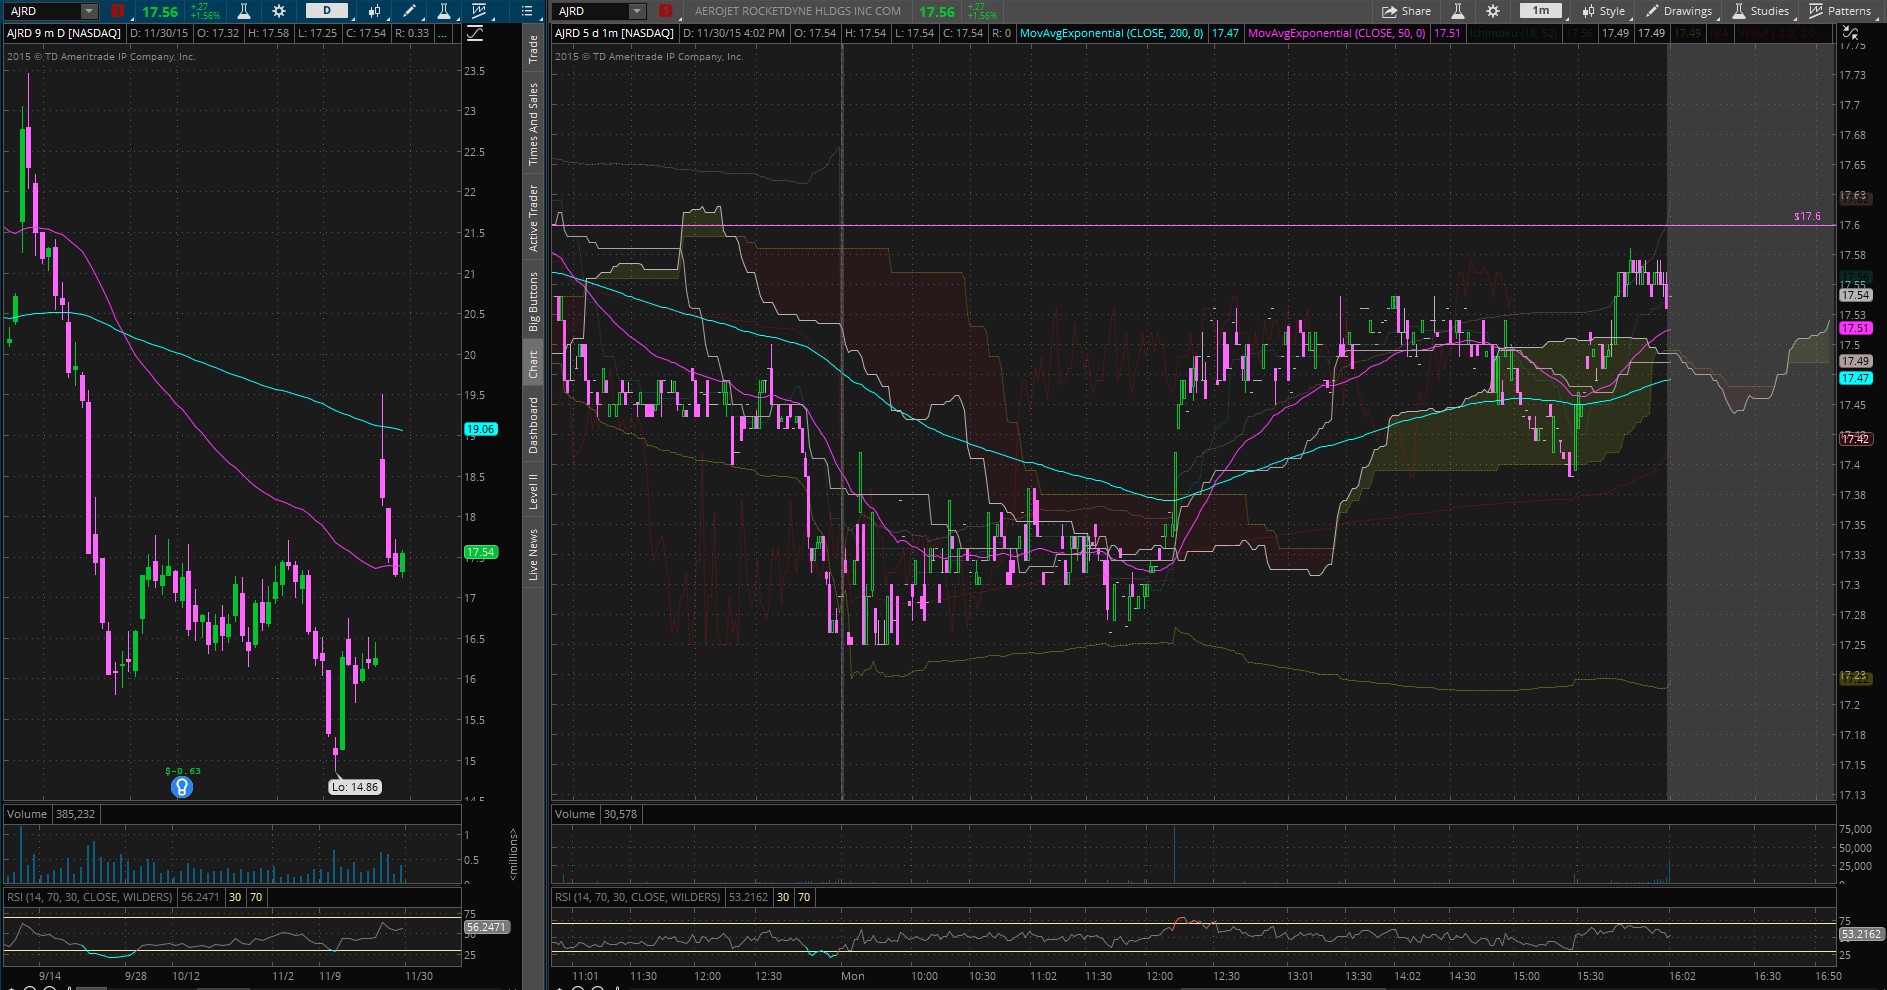
$2000 profit on AJRD on a planned trade!
27/11/2015
+€1400 on specif trades!
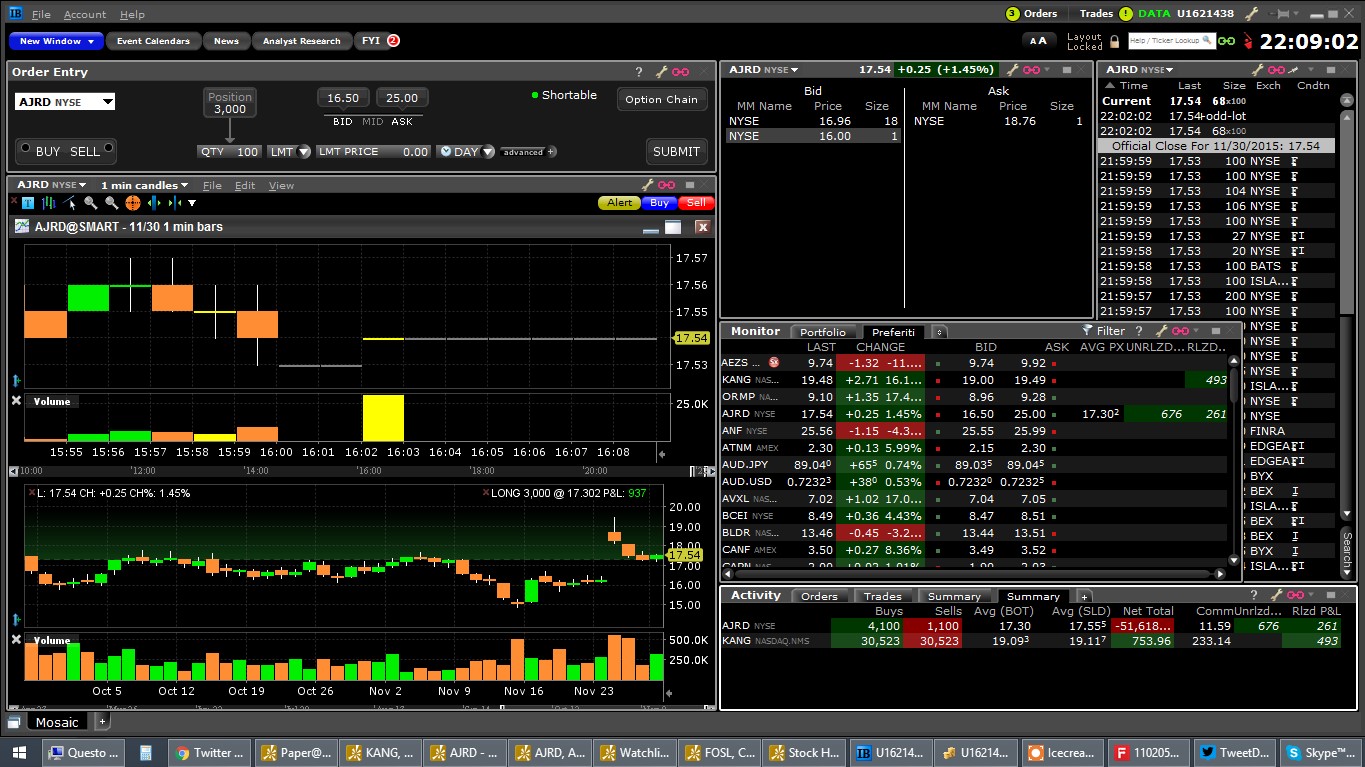
Today 2 good examples of patterns! The first is to dip buy recent Contract Winners on the daily chart dip after previous red days and after some consolidation: a beautiful example was AJRD, infact my evaluation was correct! This stock was a recent Contract Winner with NASA (for some deals about planes on the space)! As you can see on the chart the was a good gap-up but 4 days in a row of drop (red days), and todays after a consolidation around 17,25/17,30 area, and a multi-month support level around that area, I decided to buy at 17,30 for 0,05/0,08$ risk and 0,70/1$ reward!!!
Amazing, the spike and the late day squeeze, that confirms my thesys! I locked only 1000 shares from the previous 4000 shares buy and I’m holding the rest over-night!
The other one is KANG, that this morning I tried to buy on dip (I was right on the idea, but wrong on the time and I lost (bought too early), but on late day I bought again (at 19,10 and sold around 19,30sh area) expecting a short squeeze after this nice Earnings Winner! Searching for Earnings Winner and buy on specific points (on dips for example) in order to improve the Risk/Reward is the best! (I have to get credit to my Millionaire Mentor Tim Sykes!)
Here the results:

27/11/2015
Made +€960 today on a nice dip buy opportunity!
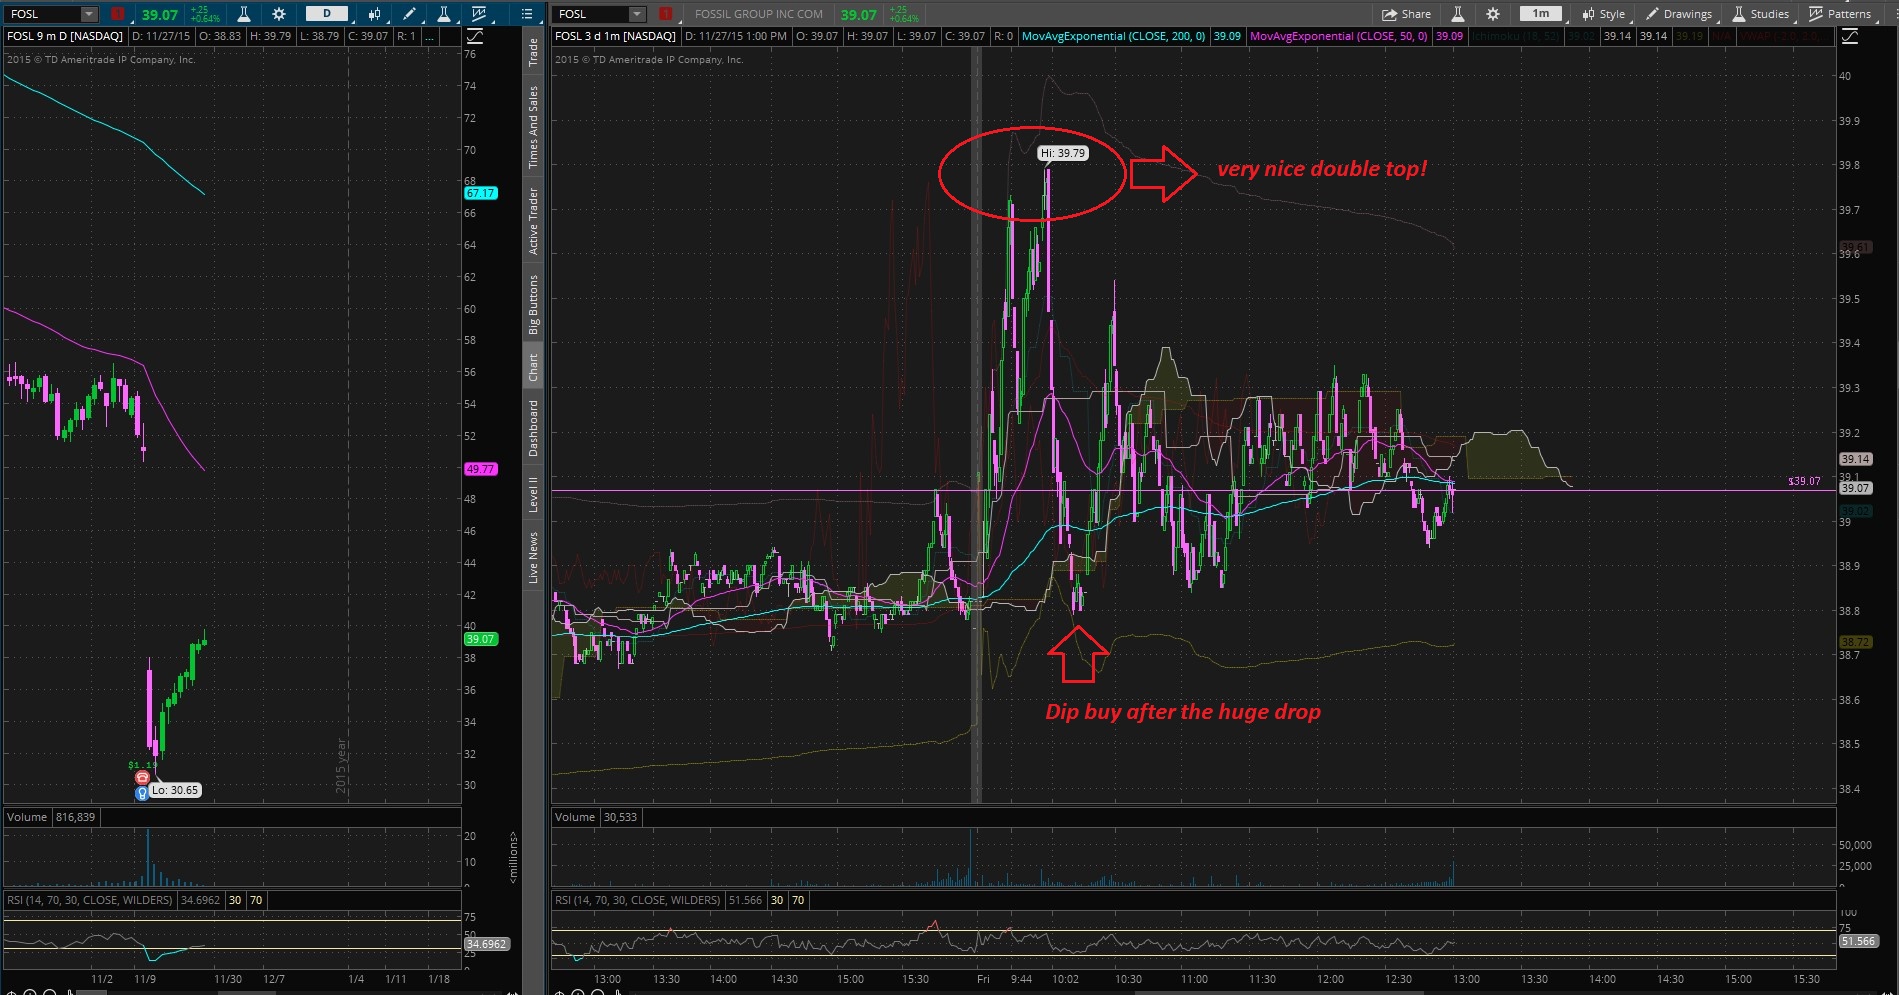
Today, to be honest I misses some good plays, but when I checked a non-popular stock in my watchlist and I saw a good pattern I immediately took advantage; I traded FOSL today on the huge dip around 38,83 and I sold around 30/30,10sh area and I made €1,280 on 5,000 shares. In this pattern many indicators were in my side, first, it’s a big dip right from the previous highs, second is near the previous low of the day and also it’s near R/G (red to green) a level where usual there are some movements and reversals! I entered with a set risk (0,05/0,08 cents, in order to make 0,20/0,30 cents and that’s a good Risk/Reward!)…it’s always good to make €1k in one trade, in 10 minutes! (I promise you, your smile become bigger and bigger 🙂 ). After that I traded VIPS, but it didn’t work and I lost €320. Overall 1k for the day!
Here the chart for FOSL (you can see also the beautiful short when there was a great double top pattern! – I missed it)
25/11/2015
(How to make a Medical Doctor paycheck in ONE day!)
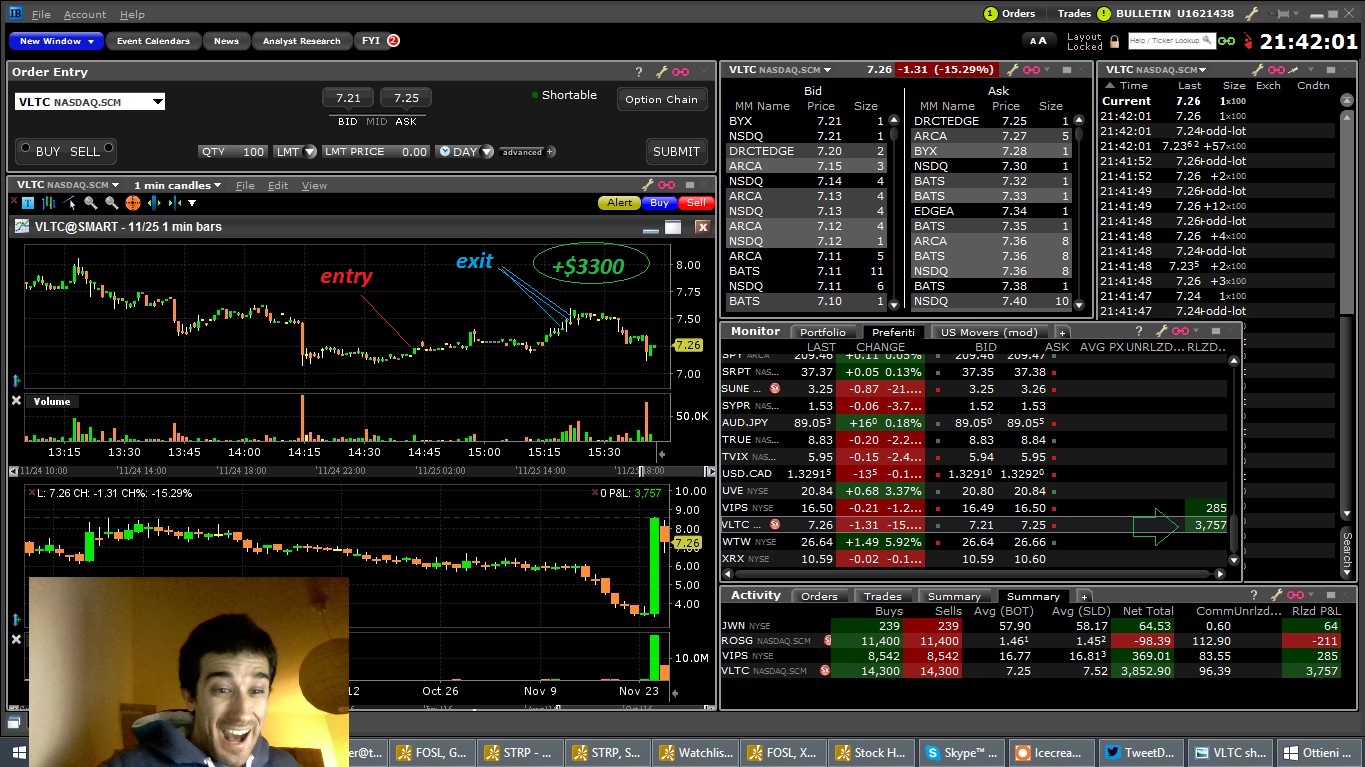
Buying opportunity on late day! +$3700 on VLTC
This lesson is very useful, because it’s the application of a repetitive pattern that happens on a late day!
Stocks with many traders involved give the possibility to good and large movements, mainly on early morning or late day near the close. Near the end of the day many traders (especially short sellers) want to get out from their positions to avoid to hold shares over-night and avoid some potential gaps, (especially on friday or before some holidays, because again short sellers are afraid for possible gaps during the weekend)…..that’s the reason!!! and in momentum stocks, many short sellers have to cover (buy) in order to exit from their positions and that causes a short squeeze and some spikes!
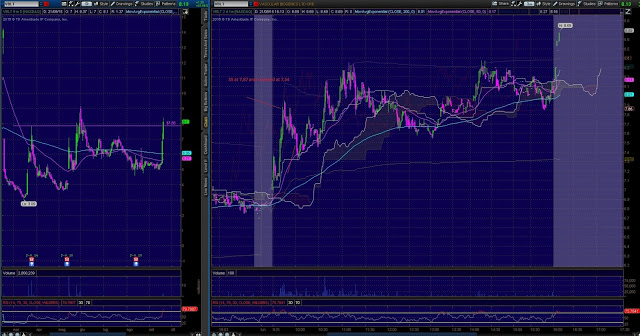
Just today near 14:40 EST time I bought 10,000 shres on VLTC at 7,20, (with 0,05/0,07 cents risk) expecting this squeeze movement, and after 45 minutes the price spiked nicely to the 7,60!! I sold partial profits near the 7,45/7,50/7,55sh level for an overall $3300 (I made also $400 buying VLTC on the morning dip). That’s fantastic!! My vision is larger! Here the pattern and my happy face!!
I have to thank my Millionaire Mentor, Tim Sykes, where I learned a lot! Here a tweet:
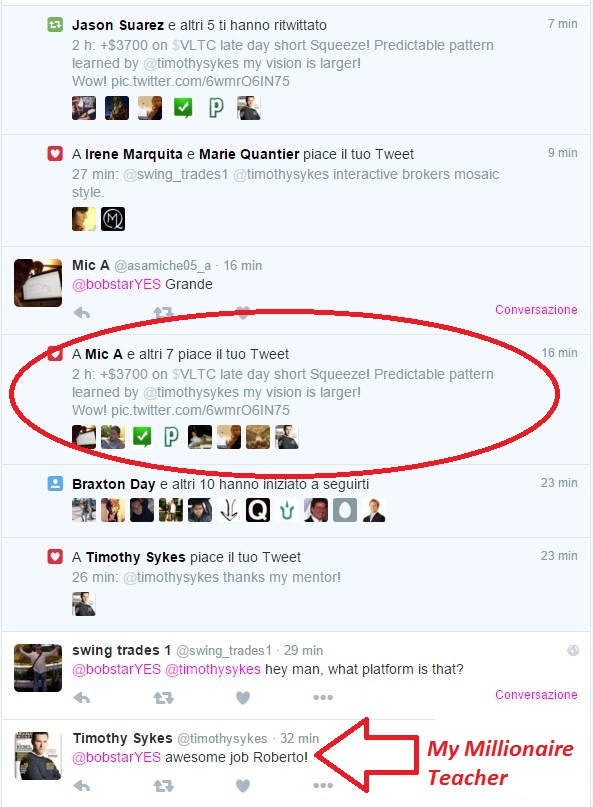
Follow me on Twitter https://twitter.com/bobstarYES
A quick video about the trade, with exact entry and exits!
22/11/2015
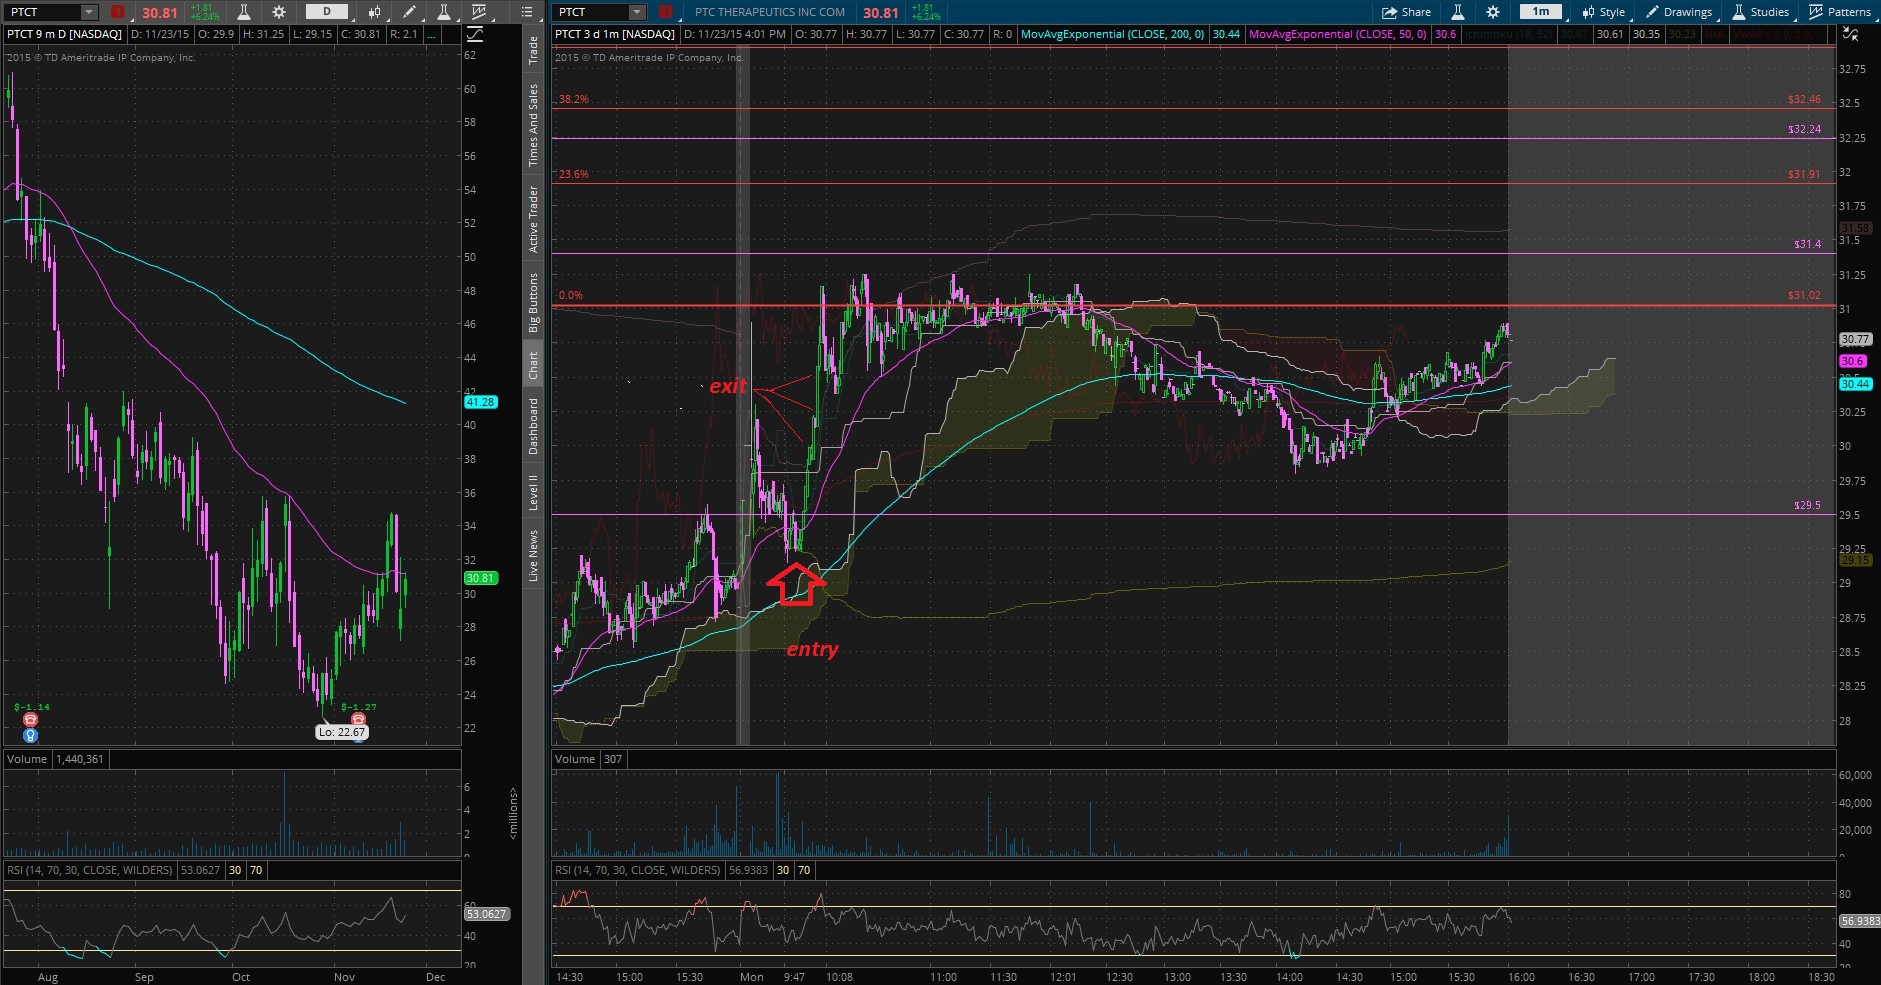
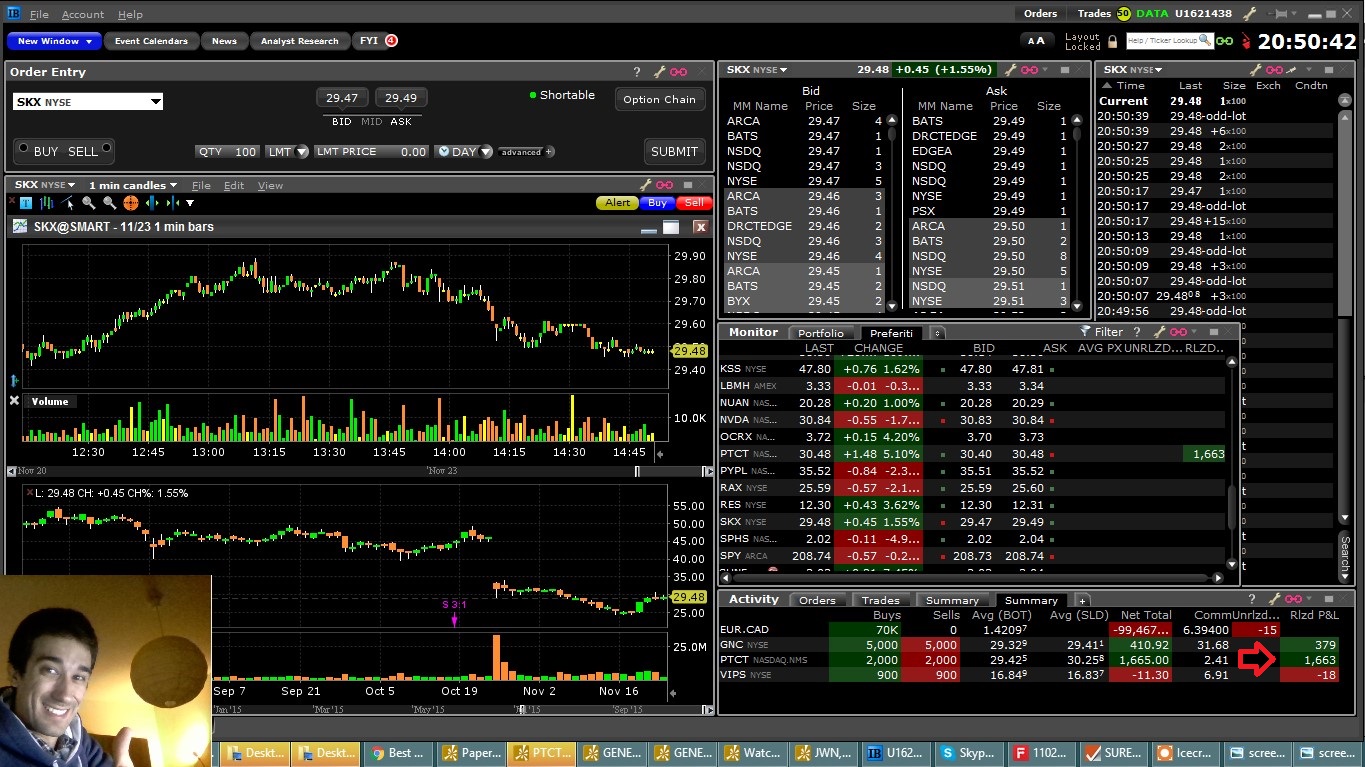
Good dip buy on PTCT for $1663 profit! The idea was to dip buy because this stock had a bad gap-down and the potential squeeze coulda happen…and it did! I bouhgt on the dip and added my position on the consolidation around 29,30/20,40 level. The spike happened and it was fast! (like the previous session, that’s why I choosed it). Great trade and my vision becomes always larger! 😉 excited!
With trading and with my powerful mind I’m changing my life!! YES! 😉
18/11/2015
Fantastic trade on GNC short for $1072 profit in 10 minutes.
Trading is powerful because you can makes your money work for you; you need to put knowledge and discipline!
12/11/2015
A great pattern about Penny Stocks!
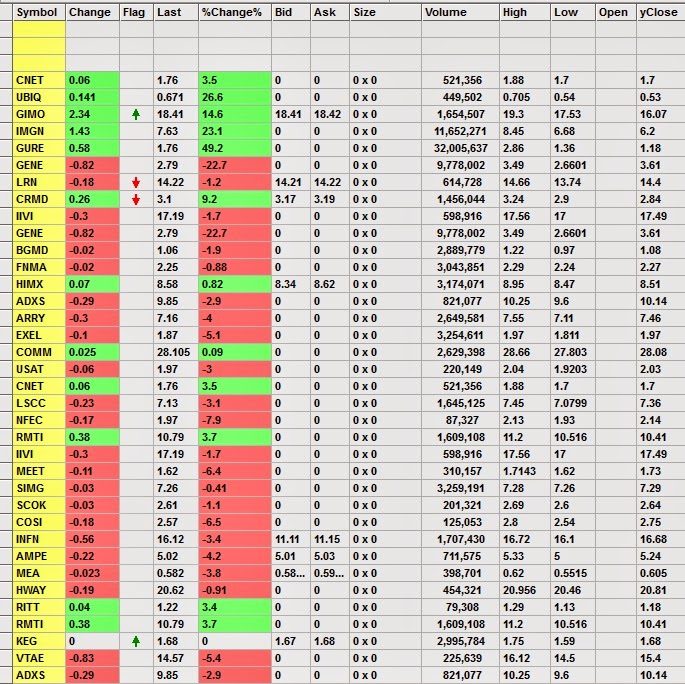
Penny Stocks are very volatile and especially in the early morning (when there is volatility), it’s usual to see 10%,20% or even 30% variation in less than an hour!
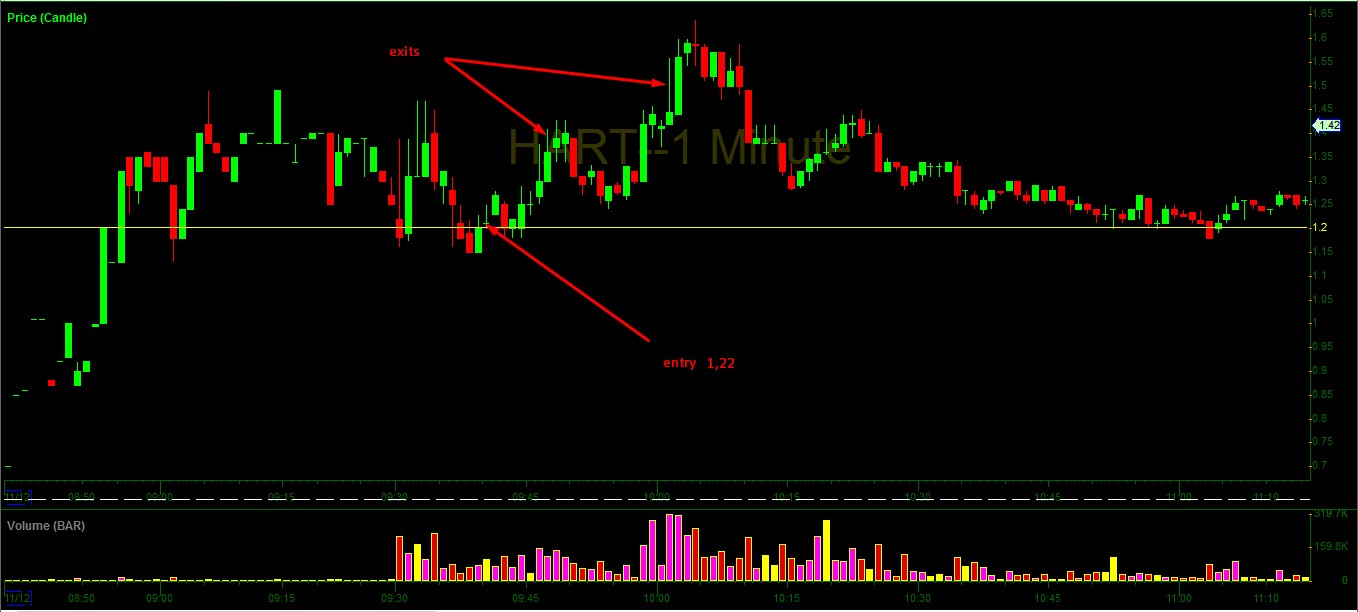
Today a nice Former Runner (typical term about stocks with momentum and big moves), HART had some news (about Biothec Technology Company) and pre-market gapped-up nicely (from the 0,60sh level to the 1,20sh), and right at the open, the volume was high!
Pre-market there was also a support forming around 1,20 and the price held very nice around this support and after 20/30 min. it spiked nicely to the 1,60sh level. That was predictable and very profitable!
I personally bought 4000 shares at 1,22 (the best entry was 1,20) with a specific risk at 1,16 (0,06 cents) and a reward around 1,45/1, 50sh area (around 0,25), a nice 1/4 Risk/Reward !
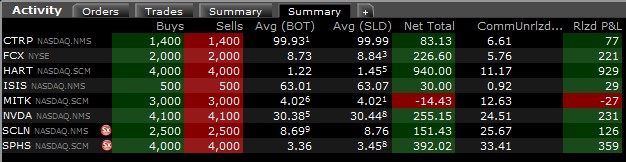
The trade worked well and I took also some strategical partial profits for an overall $929 gain ! (in 10 minutes) !
Great trade!
06/11/2015
How Tim Sykes made $1200 in 10 minutes?
The play was a long on WTW a recent Billionaire Play (by Oprah), where after the good news on the Earnings, the stock ramped all friday long! The specific pattern consists to buy on the late day expecting a short squeeze (due by traders who want to cover on thei positions); Tim bought at 23 and sold at 24,25 ! Fantastic trade!
![Penny Stocks - WTW late day Billionaire play [Tim Sykes] (06-11)](https://www.besttradingidea.com/wp-content/uploads/2015/11/Penny-Stocks-WTW-late-day-Billionaire-play-Tim-Sykes-06-11.jpg)
27/10/2015
+$1650 in total…
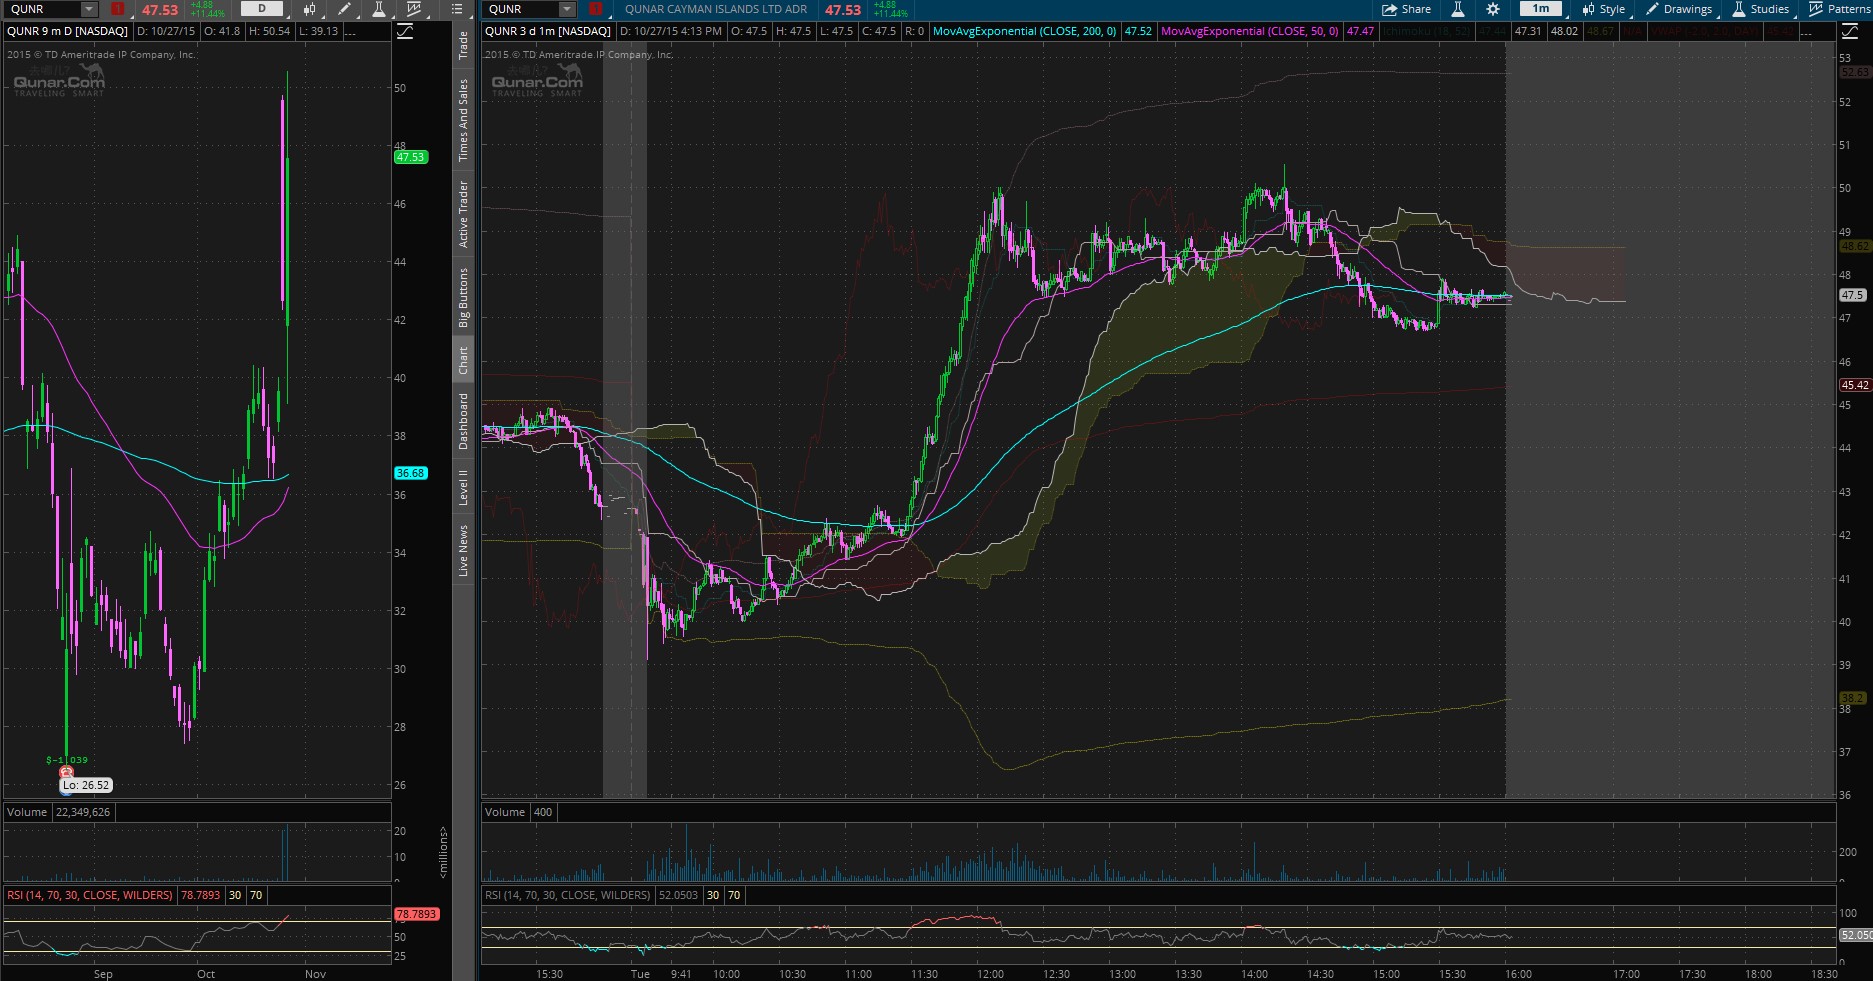
How to dip buy a Former Runner like QUNR on late day near the market close?
The reason is the predictable squeeze on the late day, because many Short traders want to cover in order to avoid a possible gap-up overinight, after a big ramp all day long
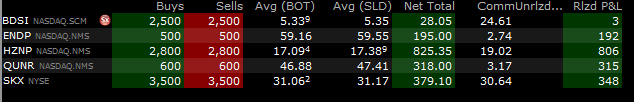
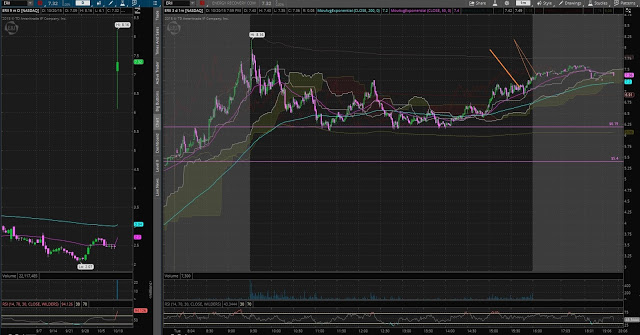
20/10/2015 – made $400 on ERII late day breakout
Today ERII had a good news and a big move (more than 200% from the previous day close); after a nice Contract Winner the price action consolidated around 6sh area, but late day the price reacted well, came step by step into the 7s area and late day brokeout some intraday resistances (7,20 for example) and kept going on the upside. I bought ERII at 7,08 (2000 shares) and I took partial profits on the first attempt and I sold all my remaining shares when the price rose pre-market..I made $378!
Tim Sykes also bought this one and made nice profits!
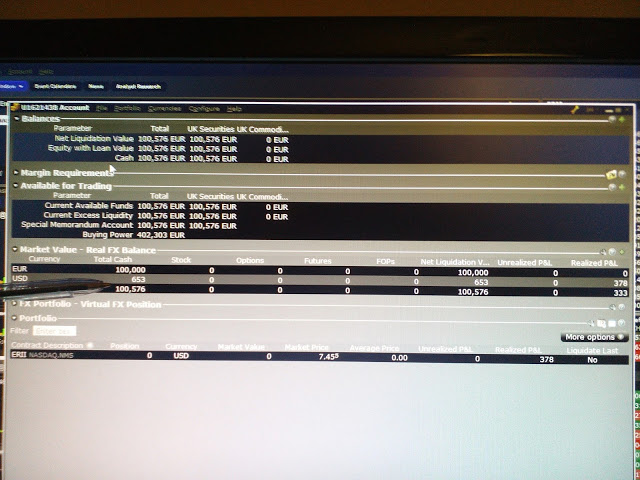
19/10/2015 – Start with big moneys
Today I started with €100.000, and it’s a new vision for me (because I traded several times with low capital). I’m pumped and now I can show my true potential!
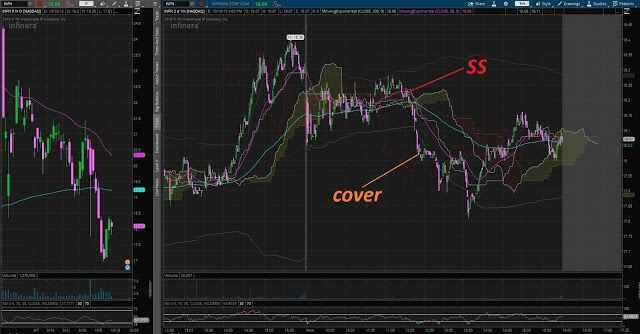
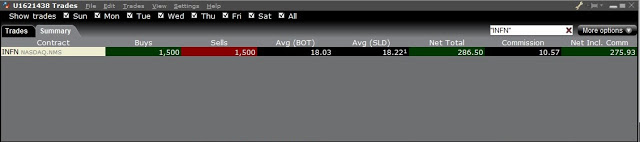
I made a trade on INFN, because the chart was over-extended and after some consolidation I took a decision to short sell only 1500 shares at 18,22 expecting 20 cents, and I took profits respecting my plan! I shorted because usually these kind of over-extentions allow a subsequetial drop.
*****************************************
Short Selling on morning spike near multi-day or multi-month resistance!
Short Sell some stocks is sometimes a good choice sometimes, especially when they shape a great over-extension; in fact, it’s usual to see some stocks that spike 30%, 40%, 50% or even more in two or one day, and the over-extention allows a natural retracement; why that? because buyers want to take their profits and some smart short sellers enter into a trade with a meticulous plan.
In order to have the odds in our favor it’s important to see other indicators, like the technical resistance level; the resistance (if it’s daily is good, if it’s weekly or monthly is better) as you should know, is a relevant level where the previous sellers prevailed on the buyers…in other words a great accumulation level. So if the spike after a morning reaction join that level of resistance many indicators can join together in order to Short Sell at that point.
Here an example on VBLT of SS at the morning spike near multi-month resistance (but should be quick, because the overall price action is strong):
*****************************************
How to trade Contract Winners
Contract Winners are those stocks that have agreed a contract or a partnership with another company in order to improve their business, and sometimes when there are good contract with big companies, the stock can raise more than 20,30 or 40% in one single day! This volatility is very attractive for traders and can give good opportunities….but most important is how to catch these opportunities.
Know how these stocks react is good but know when exactly to enter in a trade is excellent!
The best way to trade Contract Winners is to buy into the dip with some indicators and catalysts in our sides. Here for example a chart MXWL, this company has contracted an agreement with GM (General Motors)
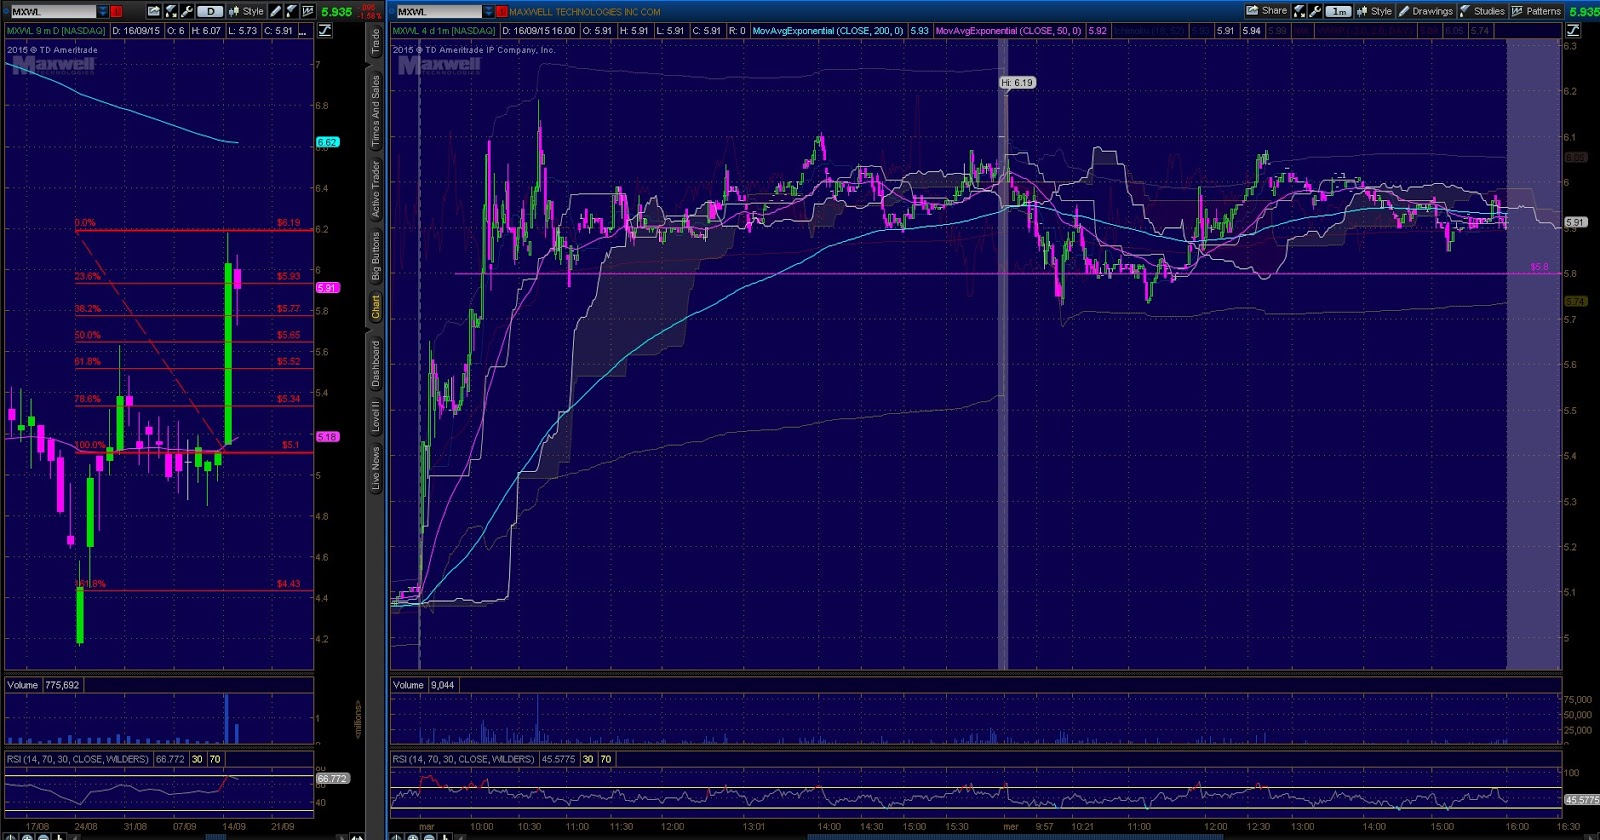
As you can see there was a good spike on the first day with more than 20% increase in one day! the best way to trade this, it’s to buy on the second day, on the dip, near a multidau support! The Fibonacci retracement helps too in order to identify potential supports. A good trade was made by the Millionaire trader Tim Sykes, who bought 7000 shares on the first dip at 5,76 and sold at 6,95 (I bought too at 5,82 and sold at 5,91)!
This predictable move is determined by the reaction of Contract Winners and this give us good odds and good patterns to focus on!
Great pattern about CW !
*****************************************
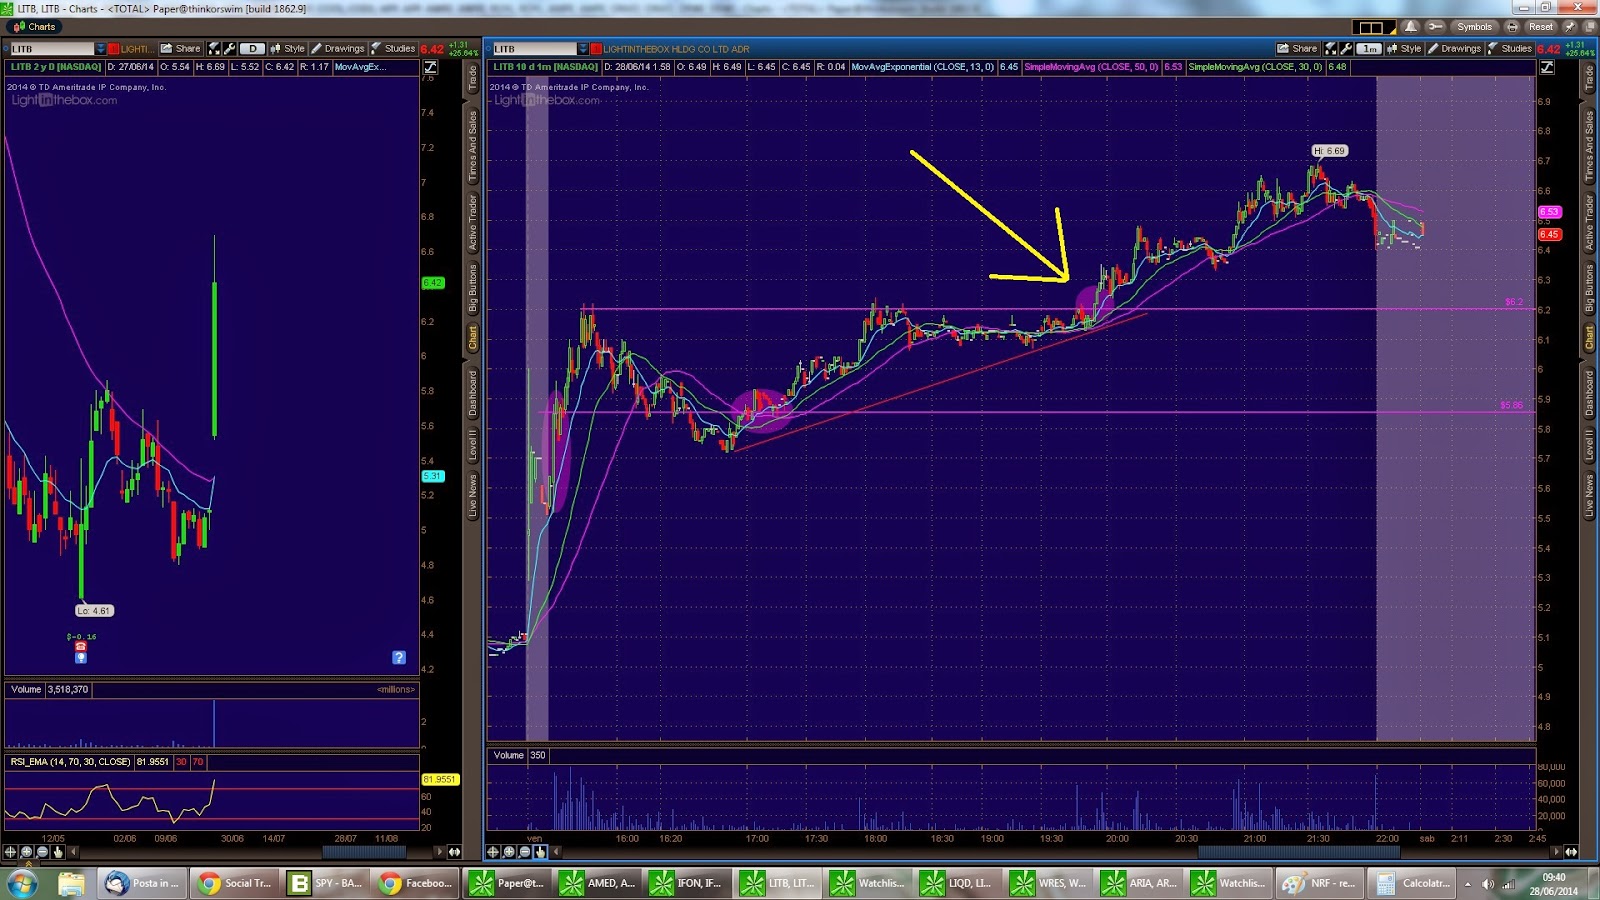
Late day buy on good Former Runners – FORD
Here a good example of a late day buy on a typical Former Runner. FORD in this case has proved to spike very strong the past few days and has often kept her gains after each spike.
As you can see on the chart below the intraday price action of FORD (1st September 2015) who late day spiked after a whole day of consolidation (and a morning spike).
Different indicators can tell us that was the moment to buy: first this stock was a recent Earnings Winner and most important a Contract Winner with a big company, second in the last few days every spike has proved to run and go higher, third, today the price action dropped down roughly 1$+/share from the previous peak high, fourth, the consolidation all day after the morning spike indicates definitely that the price action is strong! So as you can see right before the big candle (around 3:00pm) the 1.74 was a nice entry for a buy!
I’ve personally bought this stock at 1.74 and the cool thing was that the Millionaire Tim Sykes bought this one at the exact same price too (he locked more than 1.500$ in less than 1 hours!!!) !
Predictable pattern with the odds in our side!
Great one!
*****************************************
Another Pump and Dump formation on ACHN
Today ACHN was a fantastic trade for the Short side and in fact it dropped roughly $0,40/share this morning! The first question is, how to find this kind of stock? and the second might be, how to know when is the best moment to entry on this stock?
These ones are important questions and in order to trade this great pattern you have to know that well!
First is to identify the % gainers in the past few days ( in this case it was a big spike due to news, but not great news) and identify its behaviour, even in the past; the second is to to identify the exact moment (day/session) to trade, so as you can see the following day after the big ramp it was a nice morning spike, but overall the price was weak all day, the third day it was a gap-down (first signal) a morning failed spike and the a drop continuation; so actually the best moment to short this stock is after the price cracks the moving averages (50 and 200 exponential moving average) and enter with a set plan like risking 15 cents (the high of the day) and have a potential reward of 0,30 cents for the drop continuation! And this pattern will repeat over and over! I’m excited because I nailed this pattern based on calculated and set plan! I shorted at 8,60 (not the best price tho) and covered at the big drop at 8,37, for a nice +0,23 cents !!
Below the chart about ACHN
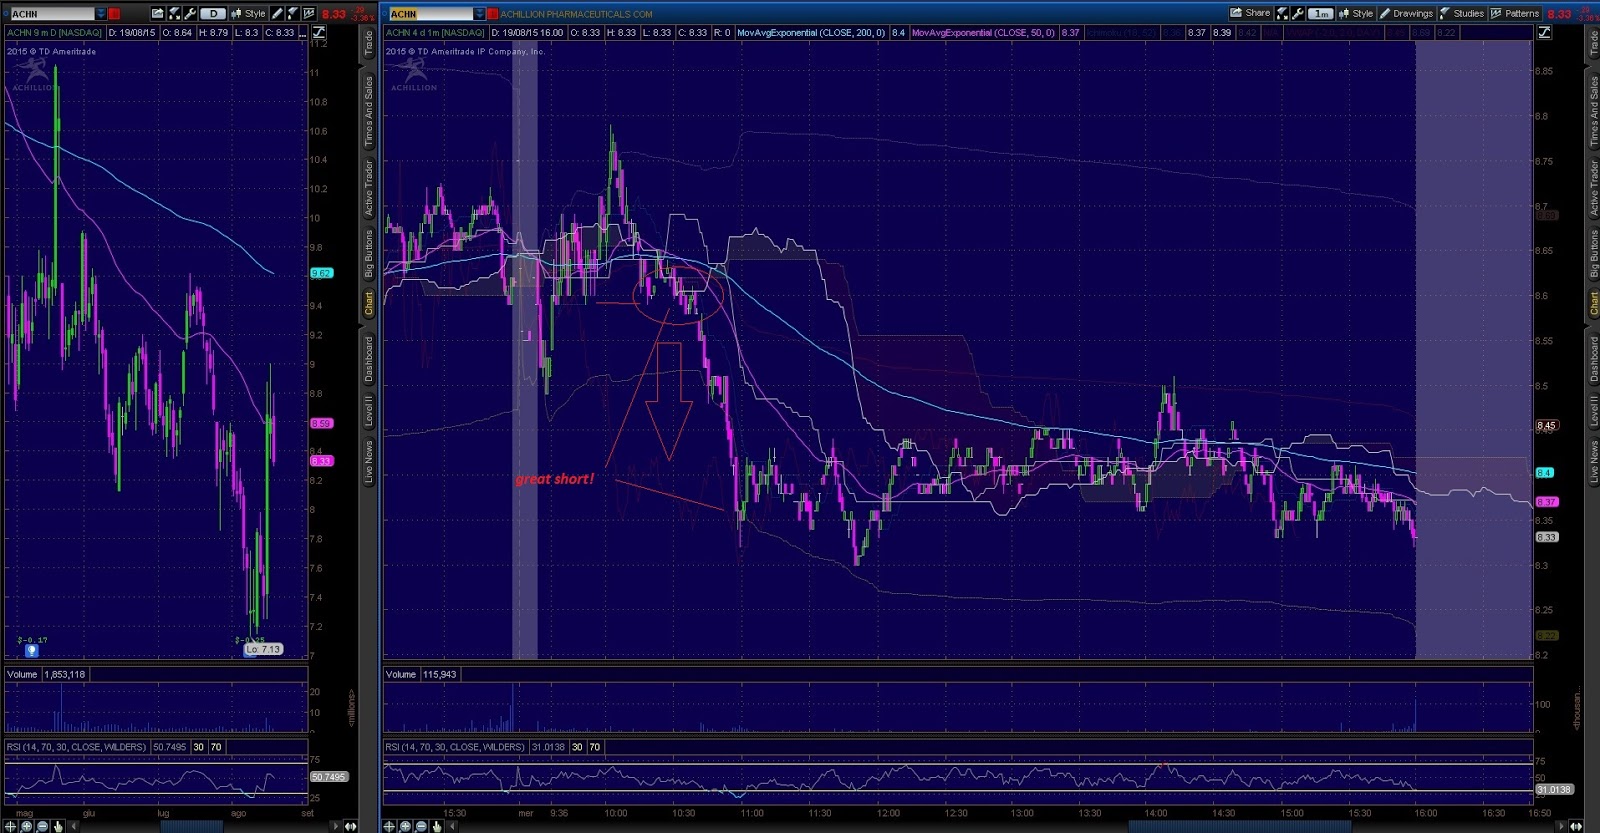
Great predictable pattern for a short side!!
Leave your comment below about your trades!
*****************************************
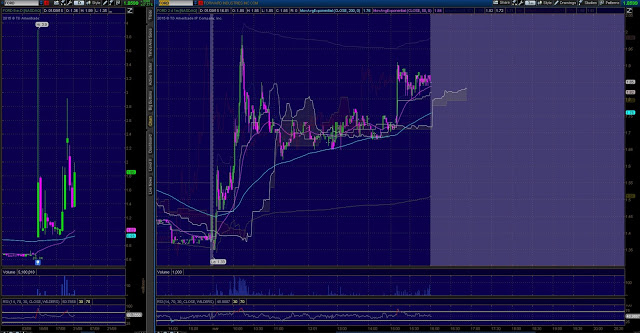
The Dump after an over-extention
In this post I share with you the effect of some news and the over-extention on stocks and penny stocks. These patterns are with other over-extended charts and very recursive!
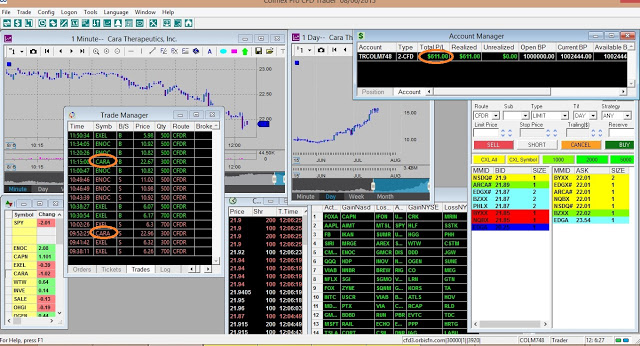
Here the chart on CARA, on the left the daily over-extended chart, and on the the right the 1 minute chart about today! (6th August 2015).
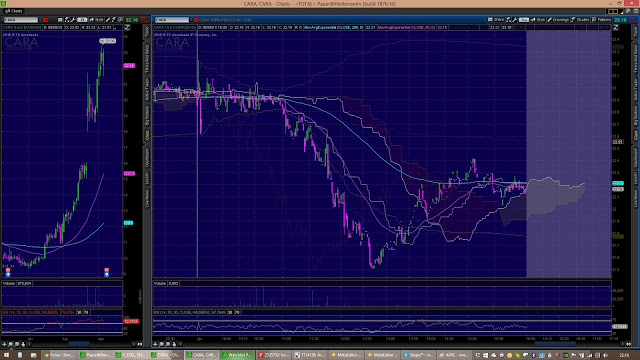
That was a great short opportunity and I personally nailed it! with a nice entry 22,97, but at not good exit as well (22,67)! You can see on the chart there were a very nice drop to 21,50 actually that’s roughly 1,50$/share in one day!
Why pick this kind of setup and how to trade it?
First you have to recognize the stock and put it in the right watchlist (see the over-extended charts), second (after an overview at the daily chart) you need to see the news on Yahoo Finance and understand why there was this kind of over-extention!
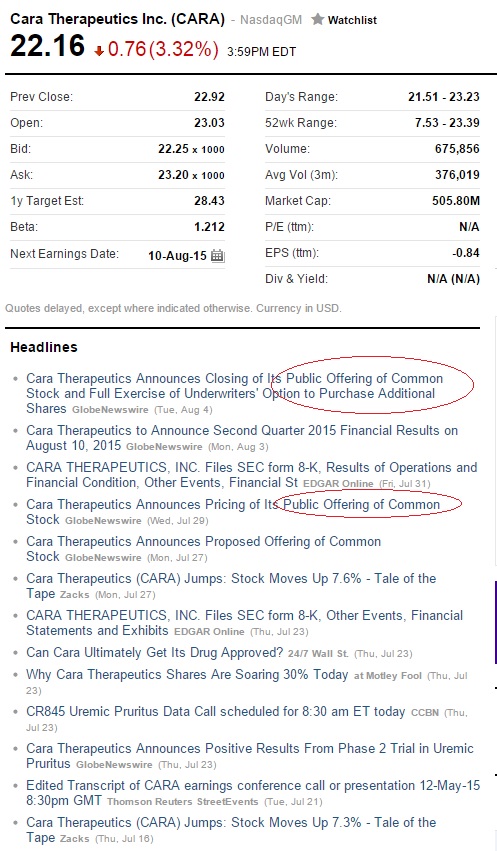 Infact some interesting coming up with news; as you can see there are some Pubblic Offering! Usually when there are these kind of news, the stock will go down because it’ll reduce its potential price.
When you see this big over-extention, trace come supports/resistences in order to have a big piture in mind.
Finally when you have familiarity with this kind of morning reactionor support breakdown, you can do it too!
So all these indicators allow a good Short trade for a nice profits! With odds in your favor and more winning trades, the strategy is absolutely wothly!
Here my real-time trades on some tickers and CARA too!
*****************************************
Cup & Handle pattern
The Cup & Handle is a typical pattern where can be found nice opportunities! This pattern is formed by a big “cup”, when the price retrace from his high and then creates a double top; here, it’s interesting because the price shapes a little retracement, called “handle”of the cup, and then with volume increases a lot and the price continues to go higher, breaking the big resistance formed by the previous double top. This breakout pattern “cup&handle” is identified in different time frames, from daily to the 1 minute; here an example of this pattern on WPCS a nice contract winner:
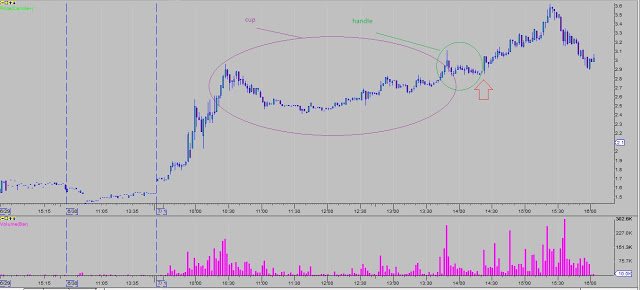
The best moment to trade is on the “handle” zone, when the volume increases, ready to break new highs!
Here another beautiful example about Cup&Handle on AXPW, alerted by this awesome millionaire guy, Tim Sykes!
Leave some comments below!
(New Stock and CFD broker)
*****************************************
A simple Strategy, the “ABCD” pattern breakout
The ABCD pattern is known as anticipation of the intraday high breakout, and can give better results for a good Risk:Reward! Here on the bottom a picture about the generic formation of the ABCD pattern:
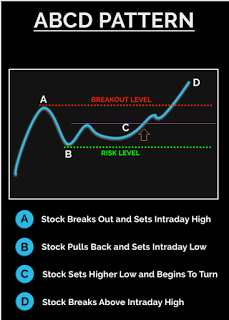
Usually, in a big morning movements or spikes the price surges to an A level, then it retraces to the B point, this re-tracement is typical because many buyers want to take profits; so, from there the price can show signal of surging again and it can form some intra-range highs (look at the range formed between the A level and the B level).
The key of this strategy is to anticipating a intraday high breakout (when the stock is volatile enough and in momentum), see higher lows forming and buying at the C level (the breakout of the intra-range high) and set a risk right below the B level and a potential reward on D level (far above the intraday high).
The biggest edge on this strategy is the risk:reward, and it can be 1:3, 1:4 or even more!
To apply this strategy it needs to have a good momentum stock, with volume, a good pattern formation and waiting from 12 p.m. to enter.
Here on the top CAPN (Capnia, Inc.), a biotech company and had good news about a Cell Anemia Development; these news give to this stock a good momentum and price action, and as you can see on the picture late day, around 2:20 p.m. there was a beautiful ABCD pattern breakout, anticipating the high of the day breakout!
Give us below your comments and your ideas about this effective strategy.
Learn how to trade like a Pro! (here)
Join on Facebook (here)

*****************************************
Risk/Reward in trading
 Risk/Reward (R: R) is a very important concept that helps a lot in your training plan management and it’s necessary to define the risk and target prior to entering into a trade.
Developing strategies with good risk/reward (1: 3 or 1: 4) combined with a high win ratio (70%, 80%, or more) is an excellent beginning for profitable trades.
Let’s do a practical example: the company GE had major corporate organization news which creates great potential for future trading sessions. If you develop a strategy to go long near support levels with careful R/R, your success rates increase dramatically! Here is the intraday chart of GE in a five minute time frame:
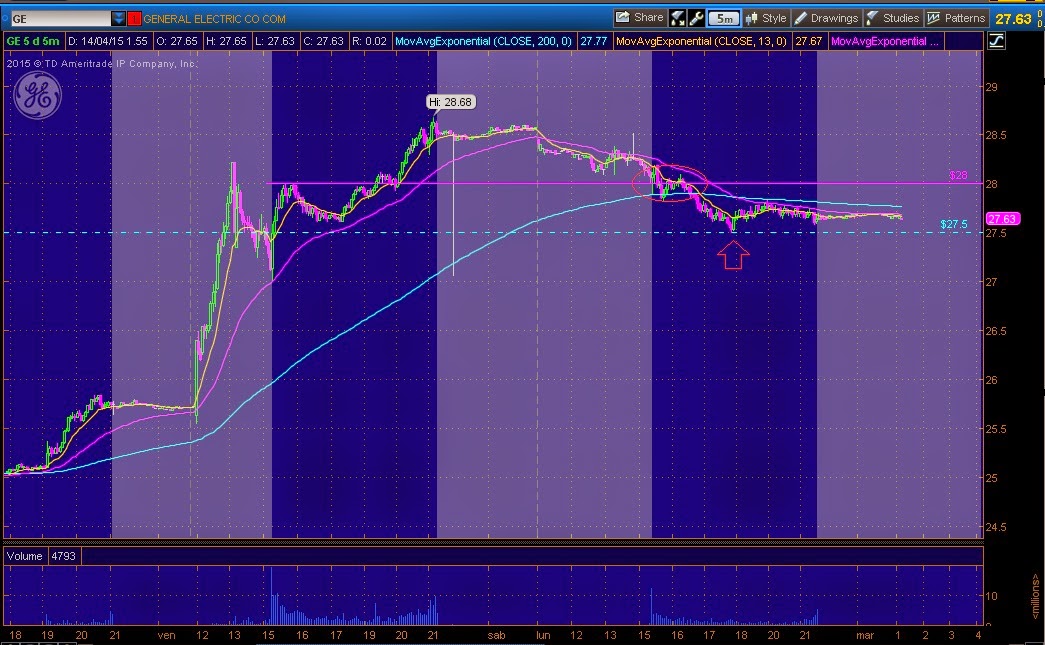
You can see that 28 is a support level outlined in the previous session. Price breaks it 2 times and continues to fall. With an accurate R: R you can buy at that level of support (in the figure above it is the area with a red circle) and exit immediately from the position with a small loss.
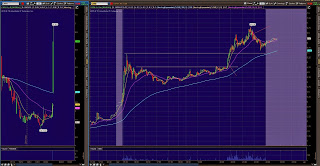
Below is the 2 day chart of GE extended to two years:
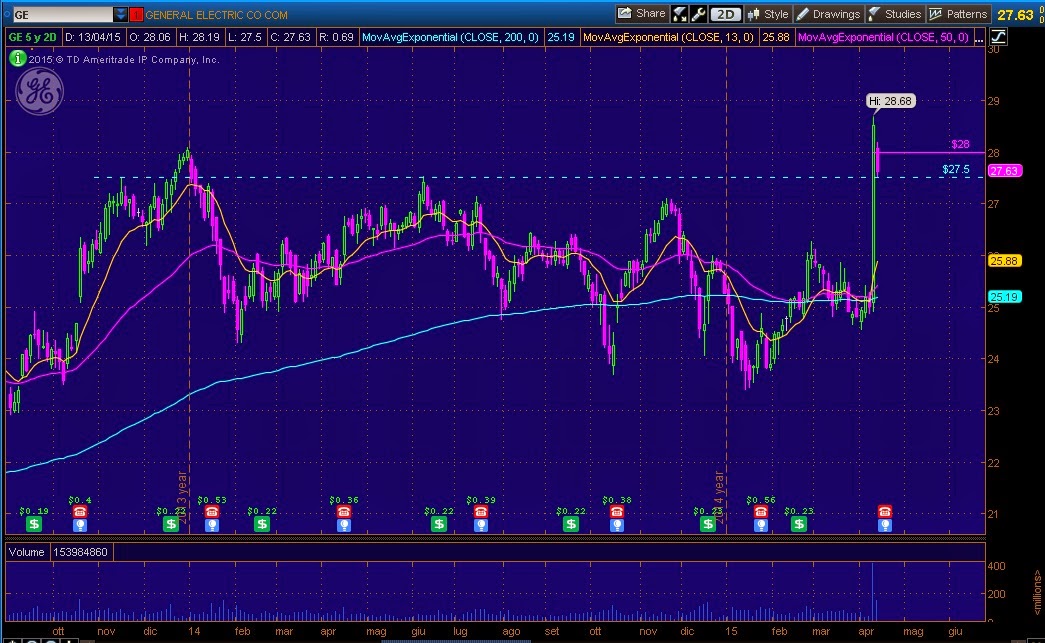
At this point is another useful support level of 27.50. This helps to create a nice predictable bounce!
In the case where a trader takes two trades long with 1000 shares each(one in the red area circle and the other near the arrow), both with a $ 0.07/share ($140) risk and $0,30/share ($600) reward (the R:R is slightly above 1: 4, excellent!) a trade is over (lost), while the other won, for a total of $0.23 earned (-$0.07 + $0,30 = $0.23) and therefore a gain of $460 ($0.23/share x 1000 shares)
What is your risk / reward? How do you handle it? Write your comment below!
*****************************************
Patterns that work again and again! (FXCM – 03/16/2015)
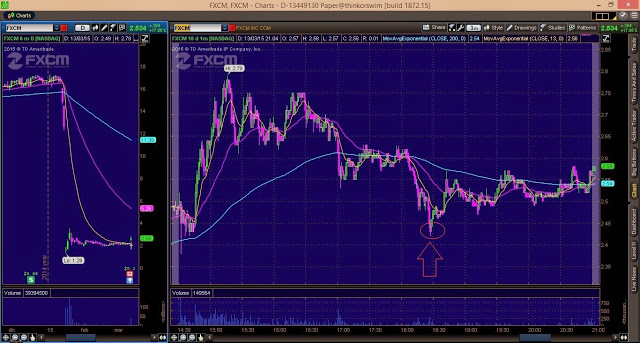
Have a clear and clean predictable pattern with an educated risk is the best thing that each trader aim to. On the top there is a chart of FXCM an earnings winner which had some interesting news. In Friday session the stock was very volatile and around 1:30 p.m. the price dropped near a good support (either multi-month and intraday support) and then bounced on this level for roughly 0.10$ ! This move is predictable!! So the best thing to do is combine all these indicators and little patterns to enter in a trade with more confidence; in this case, the earnings winner + the volatile stock + the support at 2.45 + the Friday afternoon time (often on a Friday afternoon there is a short squeeze due to many short sellers that cover positions) + a drop without a consistent bounce lead to execute that nice pattern with a set risk and for a good profit! When there are these kinds of pattern and the confidence with these is high, the size of the trade can be increased using leverage (important tool that brokers offer to their clients to allow a bigger margin than the effective cash capital in own account).
(Look also the previous post “How to trade an earnings winner?”)
Learn how to trade like a Pro! (here)
Join on Facebook (here)
*****************************************
What is a Pump & Dump and how to trade it?
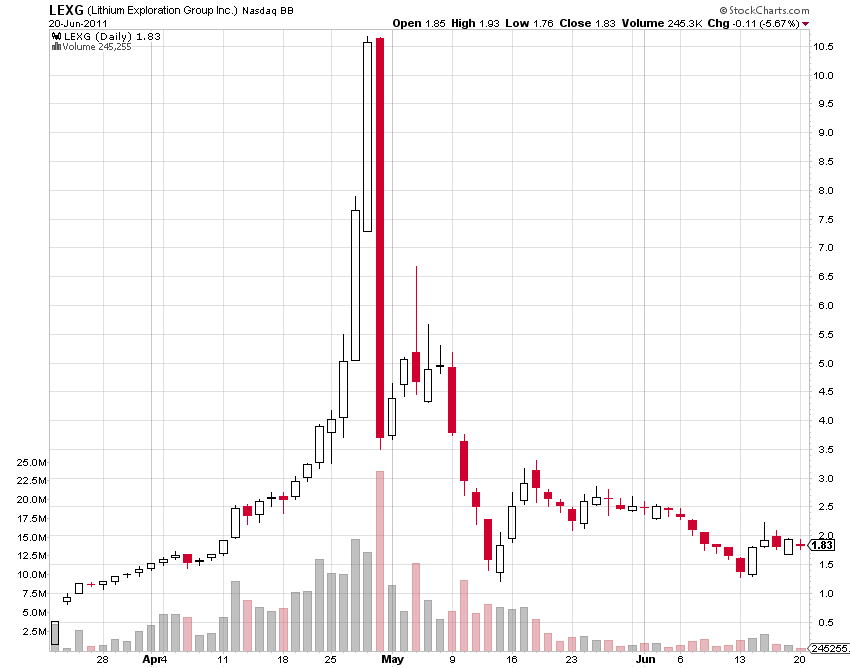 Here on the left you can see a typical Pump & Dump scheme, mainly in Penny Stock market. The price of the stock surges gradually at the beginning and grow exponentially in few days; this is caused by promoters who send emails, newsletters, hard letters, phone calls and so on, to make believe that the stock has a good potential and will be the next google or apple…which it is not at all! A bunch of people (ignorant and who don’t know this manipulation) buy the stock when the stock is high and think “yes! I will grow my account!”. These companies don’t have any internal news, any relevant cash, revenues or other important stuffs that a good company should have, and unfortunately in one day, that anyone don’t know, promoters sell all their shares and the price drops 30/40/50% or even more in one or a couple of days!! Awful…but also Awesome! In fact there are also many people, who bank, and take advantage of that; they know this manipulation and wait for the right time to Short Selling the stock on the day when the price comes to drop dramatically!! It’s important to see the momentum when the price surge exponentially like a supernova and check the right pattern when the stock comes to fall.
That’s the P&D !
Learn how to trade like a Pro! (here)
Join on Facebook (here)
*****************************************
How to trade an earnings winner?
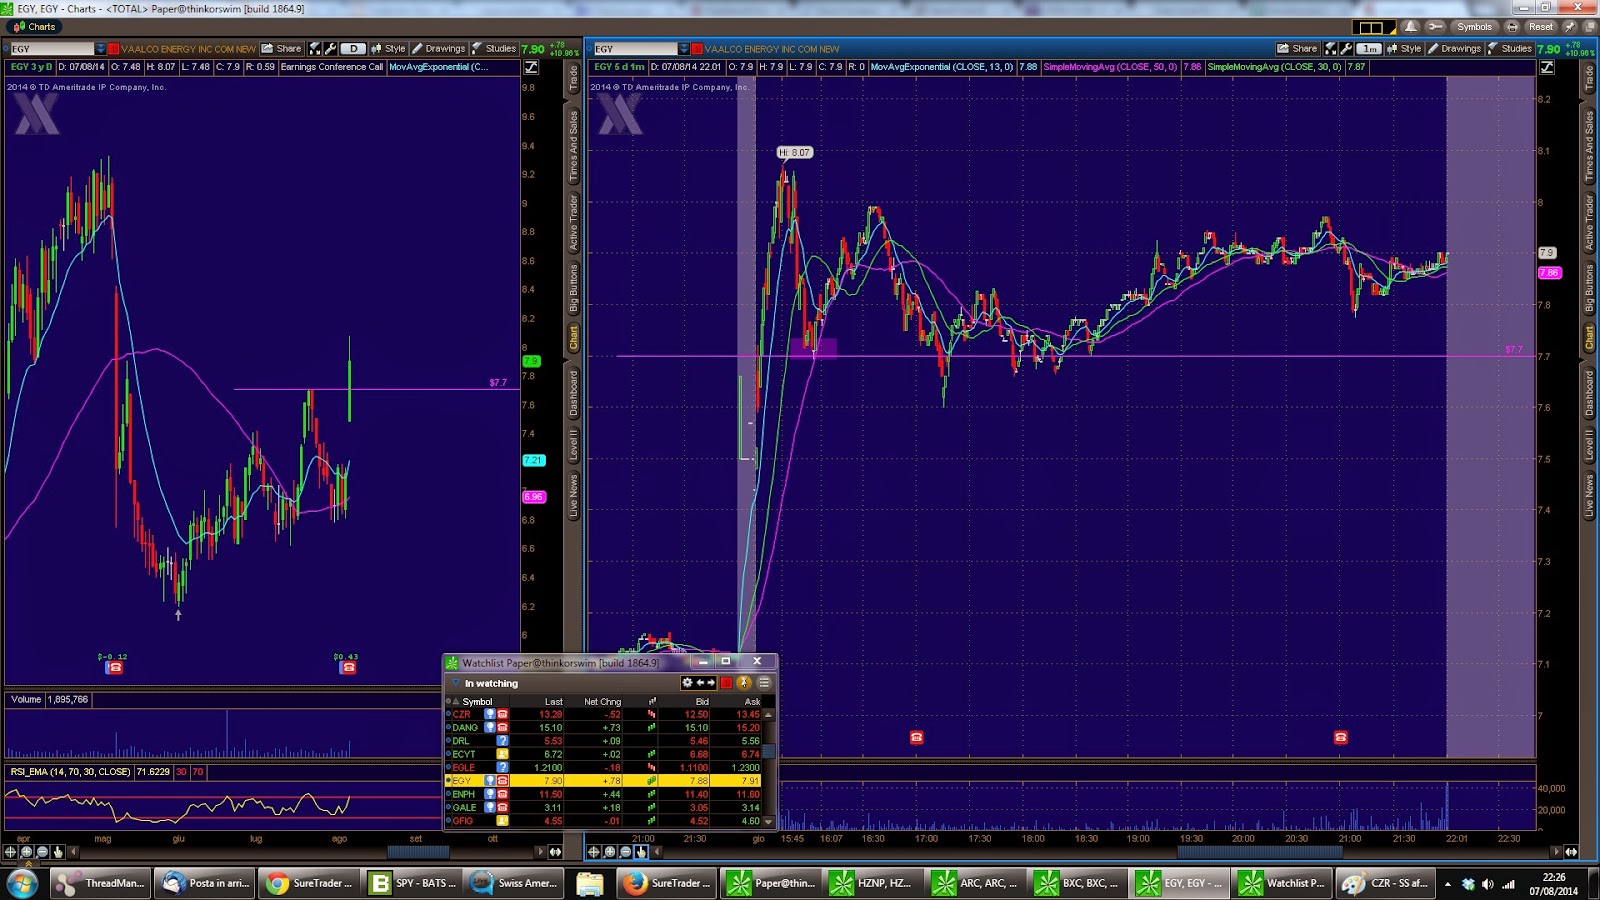
Today we talk about earnings winner! Before all an earning winner is a stock that have a good news and good earnings, and usually the price gap-up from the previous day close (it’s called positive % gainer). It’s huge important to focus on price action instead the news, so if the price action go higher and higher, the stock is a good earnings winner. The best way to trade this kind of stock is first, to check the daily chart and to look at the keys point like supports and look the mainly behavior on the past (for example if the stock usually spikes huge or not); second to wait and to look when the price drops, and sometimes comes near an important level of support, and third enter in a trade with a good risk:reward (because it’s always better to trade into the dip when the risk is better, instead to buy randomly an earnings winner).
Here a nice example (on the left the daily chart and on the right the relative intraday chart at 1 minute), in this case there is a support at 7.7 [EGY]
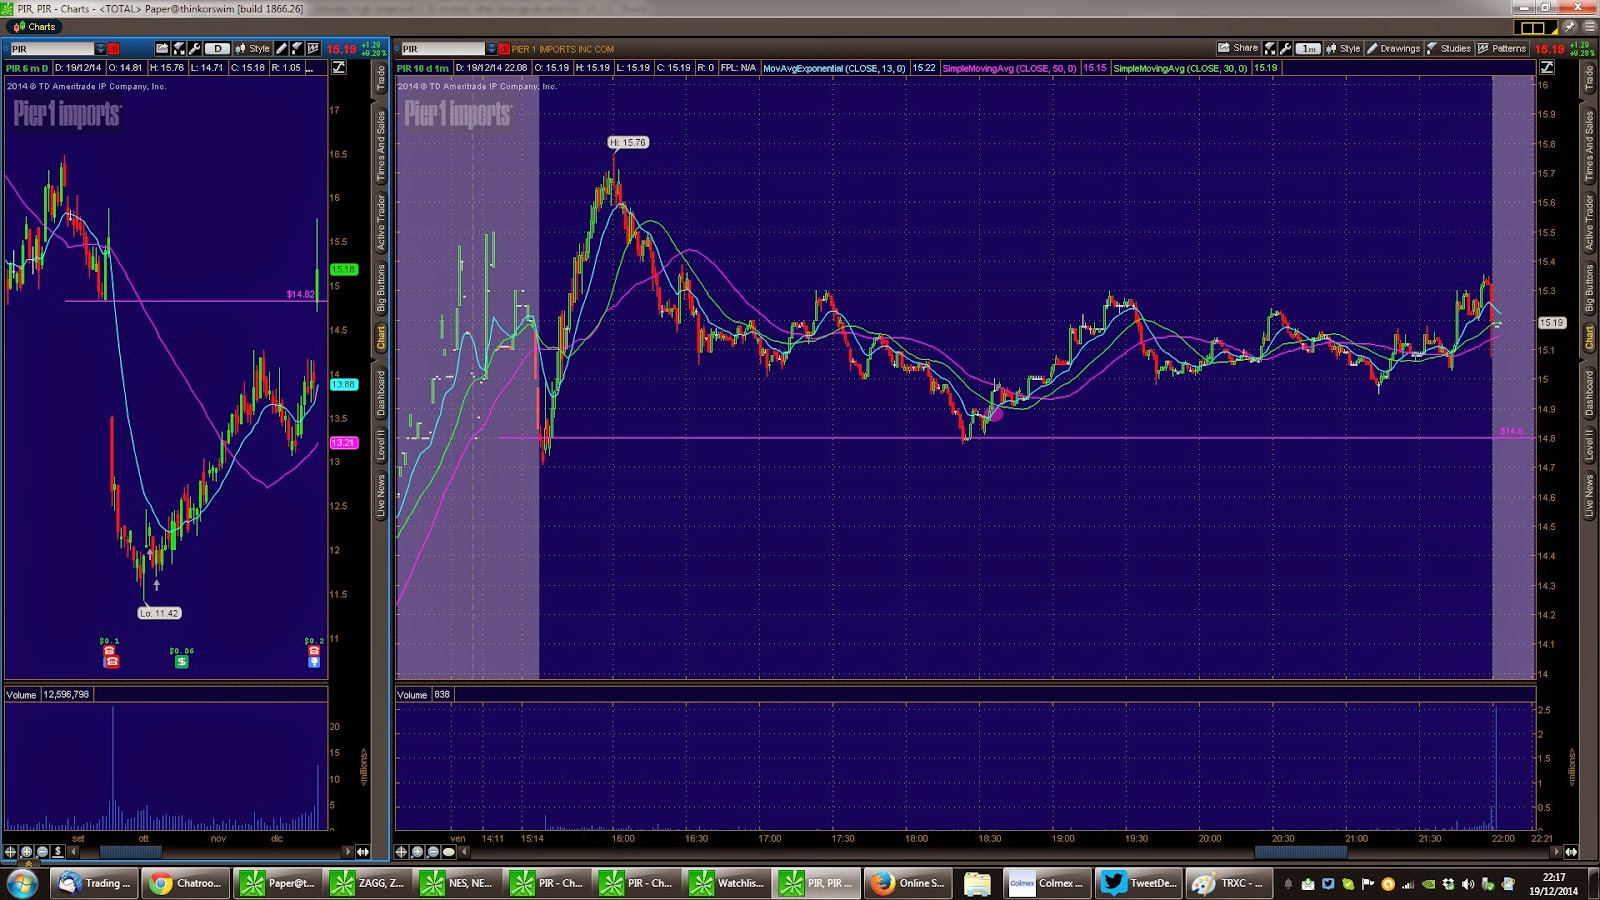
Here another earnings winner, where the price bounce on technical multi-month support and nearly 1$ off its morning high 15.76 [PIR]
Learn how to trade like a Pro! (here)
Join on Facebook (here)
*****************************************
How to build up a great watchlist
 A watchlist is simple basket of tickers, very important to see and take control when some patterns appear. So, for build a watchlist there are 4 main steps:
1) Screen stocks with tools like Finiviz or Yahoo Finance and sort them with % gainers (best gainers on the top); look the liquidity (the amount of trades on the day) and the volatility (the amounts of $ traded on the day), in other words it needs to select stocks with at least 200.000 or 300.000 $ per day. Take in consideration stocks with minimum of 10% of %Change.
2) Put all these stocks in a file word, or in a basket and check those with a good chart pattern (for example stocks that have breakout previous resistance, or former runner, stocks where might present some familiar patterns or stocks in play); remove all the others tickers didn’t fit our requirement.
3) Check for each stock in the basket, the relative news on Yahoo Finance and understand which are the most important for. It can be an Earning Winner or a Contract Winner, or have press releases and innovative news. For example a stock with Earning Winner and a good price action should be watched like a hawk for potential beautiful patterns.
4) Trace key levels of reference, resistances, supports, and watch ahead on time for potential breakouts or breakdowns or for typical patterns like a Pump and Dump, morning washout and retracement and so on…
It’s necessary to leave in the watchilst some stocks for good patterns, but it’s also better to manage a smooth one with at most 20 or 30 stocks and screen every stock every two hours. The tickers can be left in the watchlist for some days but, when there is no potential in, it should to delete these ones.
I hope it’s useful for you traders. see you on the next post…
(Take advantage from a Millionaire Guru, Tim Sykes, teachings)
Join on Facebook (here)
*****************************************
What is a breakout and how to trade it?
 A breakout is a simple pattern when the price breaks a level of resistance and typically there is also a huge volume that confirms that. Breakout is important because it’s a nice pattern to take advantage and profit with a good risk reward! But how can you trade it? First of all you should to trace and identify resistance levels, drawing an horizontal line from the top of the day (or form the intraday high) and the high of the daily chart (multi-day or multi-month);
then look at the price action and see when the higher lows goes to forming (often you can see a triangle formation); after identifying the pattern, check the time because the best breakouts happen on the late day of the trading session. Set a good risk (typically on the previous low) and set a mental target; wait for a confirmation (a little break) and enter into the trade with decision.
You can see these 2 pics about breakou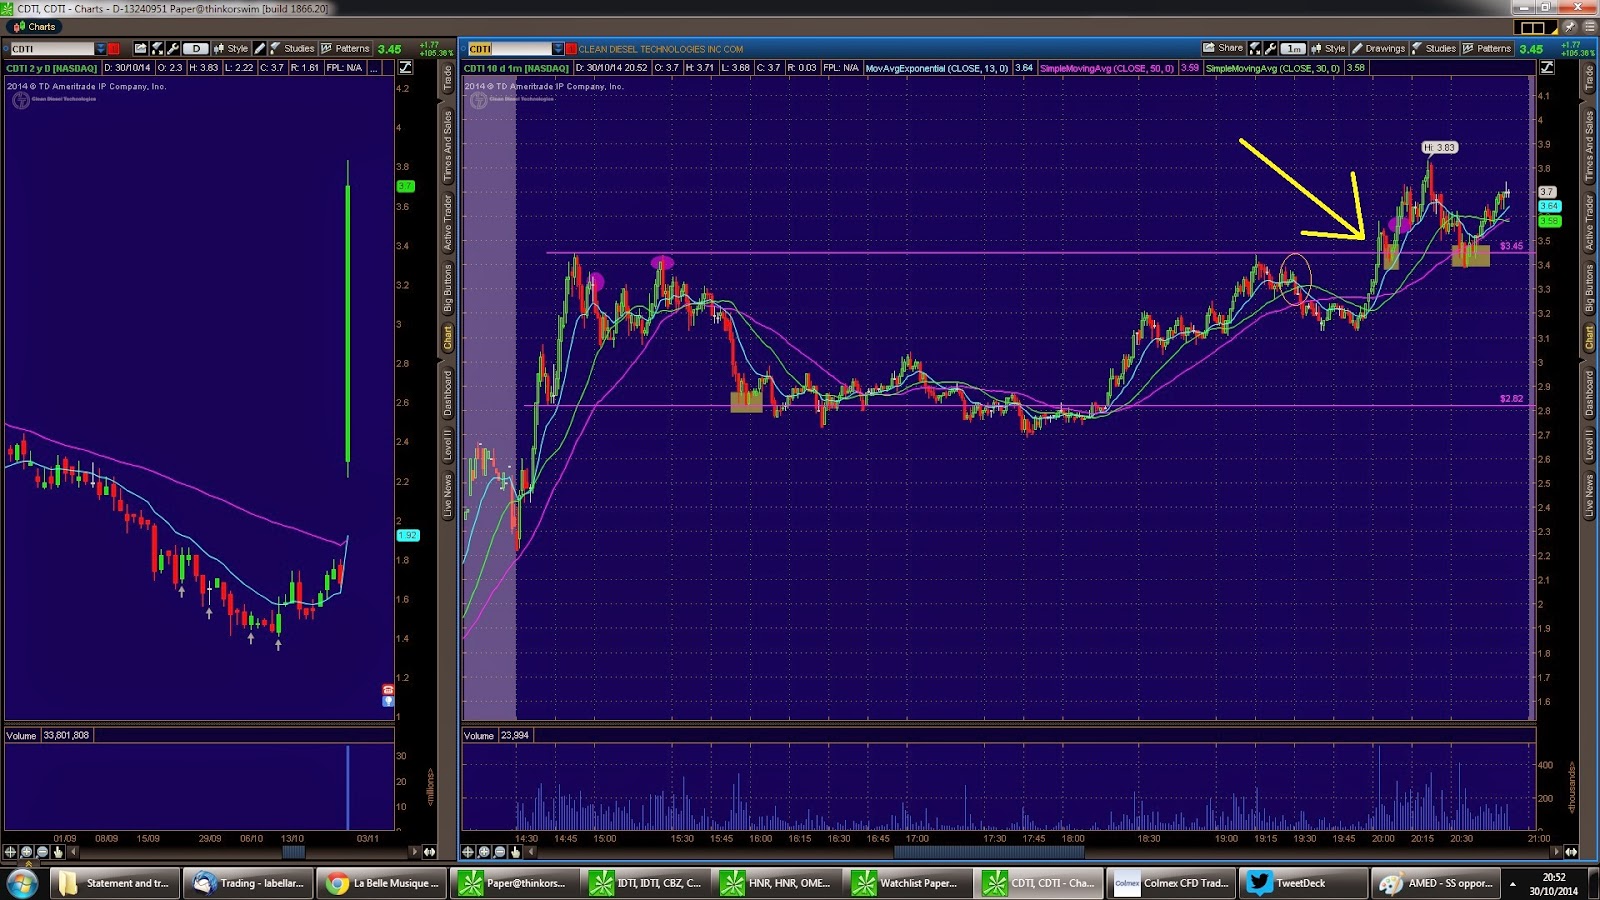 ts (in the picture, the left side is a daily chart and the right side is the related intraday 1 minute chart)
*****************************************
How to start with trading?
 For many people trading can be a very strange and mysterious world, and for those who want to start don’t know how.
Here 5 simple steps to make to start with trading:
1) Let you inspire from successful traders and the unlimited possibilities
It’s important to know and to see what is possible with trading, and to kindle your desire to change your life! Motivation and passion are the key to succeed, because the path of trading can be very hard and with lot of frustration, but with a good motivation in head you can overcome all! see this nice video (here)
2) Contact other traders and find your niche
There are many traders that can give you some advices and explain about trading; they can show you a bunch of new things and it can be very useful; you can share with them your ideas, strategies and create an interesting work group! But not let you influence by other picks or ideas, because 90% of traders fail and only 10% earn steadily in the market! After that you should to find a particular niche where interest you, for example, options, forex, stocks, and so on….
3) Find a mentor
Find a mentor or a coach that can guide you and can give you the essential tools to study and work; you can learn a lot from a teacher that give you years of knowledge! (here) a awesome guy who teach to trade stocks
4) Study hard and develop a plan
There a no way to succeed in any area if you don’t put time and efforts, especially in trading! Study a lot, read books, study the trades of profitable traders, watch and study video lessons, develop a good plan (write it down) and improve every day!
5) Develop self-confidence and discipline
The psychology in trading matter 90%, only 10% is strategy; to have a good mindset, you should to have more confidence in yourself, develop discipline (that means you should stick with your rules and plan) and …think big! trading is a place that make your money work for you, with the goal to be financial free!
*****************************************
Penny Stock, what is it?
 Penny Stock Millionaire teach how to trade stocks Penny Stock is a particular niche of the whole stock market, that includes stocks under 5$/share! Yes, small company with few products or few employees that are listed in the market.
Some of these stocks can grow fast (20%, 30% and more) in a little period of time, which is involved a good volatility and sometimes liquidity, and for few expert traders, that can bring them beautiful opportunities!
The main difference between the penny stocks and the other companies like Google or Apple is the volatility, and the change variation in %. It’s nearly impossible to see these big colossal stocks change 40/50 % in a couple of days, but in the penny stocks market it’s possible. That means you can profit 20,30 or even 50% of you account in a short period of time! Yes it’s possible and it’s the dream of many people that don’t know this beautiful piece of the pie of the entire stock market!
See you on the next post…
Learn from the best penny stocks traders in the world! (here)